The function caHomeRTE() simulates the growth of L. monocytogenes in RTE diced cantaloupe at home,
and is based on the function caGrowthBaranyi(). The algorithm samples home storage time and temperature
at the unit level since they depend on the consumer. The input data provides the algorithm with the lot-specific values of EGR5
and the unit-specific values of lnQt obtained from the previous logistics stage. Pert distributions represent the variability
in home storage time and temperature.
Usage
caHomeRTE(
  data = list(),
  MPD = NULL,
  Tmin = -2.0196,
  tempMin,
  tempMode,
  tempMax,
  timeMin,
  timeMode,
  timeMax
)
Arguments
- data
a list of:
- N
(
CFU) A matrix containing the numbers of L. monocytogenes in packs of RTE diced cantaloupe at the end of transport to retail, from contaminated lots;- P
Prevalence of contaminated lots (scalar);
- lnQt
Natural log of the
Qparameter at the end of transport to retail (matrix);- lotEGR5
(\(h^{-1}\)) Growth rate of L. monocytogenes in cantaloupe flesh specific to every lot (vector);
- unitSize
(
g) Weight of a pack of cantaloupe dices.
- MPD
(log10 CFU/g) Maximum population density of L. monocytogenes in cantaloupe flesh (scalar).
- Tmin
(\(^\circ C\)) Nominal minimum temperature for growth of L. monocytogenes in cantaloupe flesh (suggested \(value=-2.0196\ ^\circ C\)) (scalar).
- tempMin
(\(^\circ C\)) Minimum retail temperature (scalar) (suggested \(value=3.10\ ^\circ C\)) (scalar).
- tempMode
(\(^\circ C\)) Mode of the retail temperature (scalar) (suggested \(value=6.64\ ^\circ C\)) (scalar).
- tempMax
(\(^\circ\) C) Maximum retail temperature (scalar) (suggested \(value=11.3\ ^\circ C\)) (scalar).
- timeMin
(
h) Minimum retail time (scalar).- timeMode
(
h) Mode of the retail time (scalar).- timeMax
(
h) Maximum retail time (scalar).
Value
A list of two elements:
- N
(
CFU) A matrix containing the numbers of L. monocytogenes in packs of RTE diced cantaloupe at the point of consumption, from contaminated lots;- P
Prevalence of RTE diced cantaloupe lots contaminated with L. monocytogenes (scalar).
Note
The suggested parameters for the Pert distribution of retail temperature are taken from Carrasco et al. (2010)
,
Ding et al. (2013)
and Nauta et al. (2003)
: \(tempMin=3.10\ ^\circ C\), \(Temp\_mode=6.64\ ^\circ C\)
and \(Temp\_max=11.3\ ^\circ C\).
The parameter \(Tmin=-2.0196\ ^\circ C\) was determined from fitting a square-root model to data extracted from multiple sources
(refer to the function caGrowthBaranyi()).
Parameters for the home storage time distribution should be defined by the user and/or tested in scenarios.
References
Pouillot R, Delignette-Muller M (2010). “Evaluating variability and uncertainty in microbial quantitative risk assessment using two R packages.” International Journal of Food Microbiology, 142(3), 330-40. Carrasco E, Pérez-Rodríguez F, Valero A, García-Gimeno RM, Zurera G (2010). “Risk Assessment and Management of Listeria Monocytogenes in Ready-to-Eat Lettuce Salads.” Comprehensive reviews in food science and food safety, 9(5), 498-512. ISSN 1541-4337 1541-4337, doi:10.1111\%2fj.1541-4337.2010.00123.x . Ding T, Iwahori J, Kasuga F, Wang J, Forghani F, Park M, Oh D (2013). “Risk assessment for Listeria monocytogenes on lettuce from farm to table in Korea.” Food Control, 30(1), 190-199. doi:doi=10.1016\%2fj.foodcont.2012.07.014 . Nauta MJ, Litman S, Barker GC, Carlin F (2003). “A retail and consumer phase model for exposure assessment of Bacillus cereus.” International Journal of Food Microbiology, 83, 205-218.
Author
Ursula Gonzales-Barron ubarron@ipb.pt
Examples
timeMin <- 0.25
timeMode <- 3
timeMax <- 24
nLots <- 1000
sizeLot <- 250
N <- matrix(320, nLots, sizeLot)
N[2, ] <- 0
lnQt <- matrix(3.5, nLots, sizeLot)
lnQt[2, ] <- 0
data <- list(
N = N, lnQt = lnQt,
lotEGR5 = extraDistr::rtnorm(nLots, 0.03557288, 0.004, a = 0),
P = 0.4, unitSize = 200
)
AtConsumption <- caHomeRTE(data,
MPD = 8.5, Tmin = -2.0196,
tempMin = 3.1, tempMode = 6.64, tempMax = 11.3,
timeMin, timeMode, timeMax
)
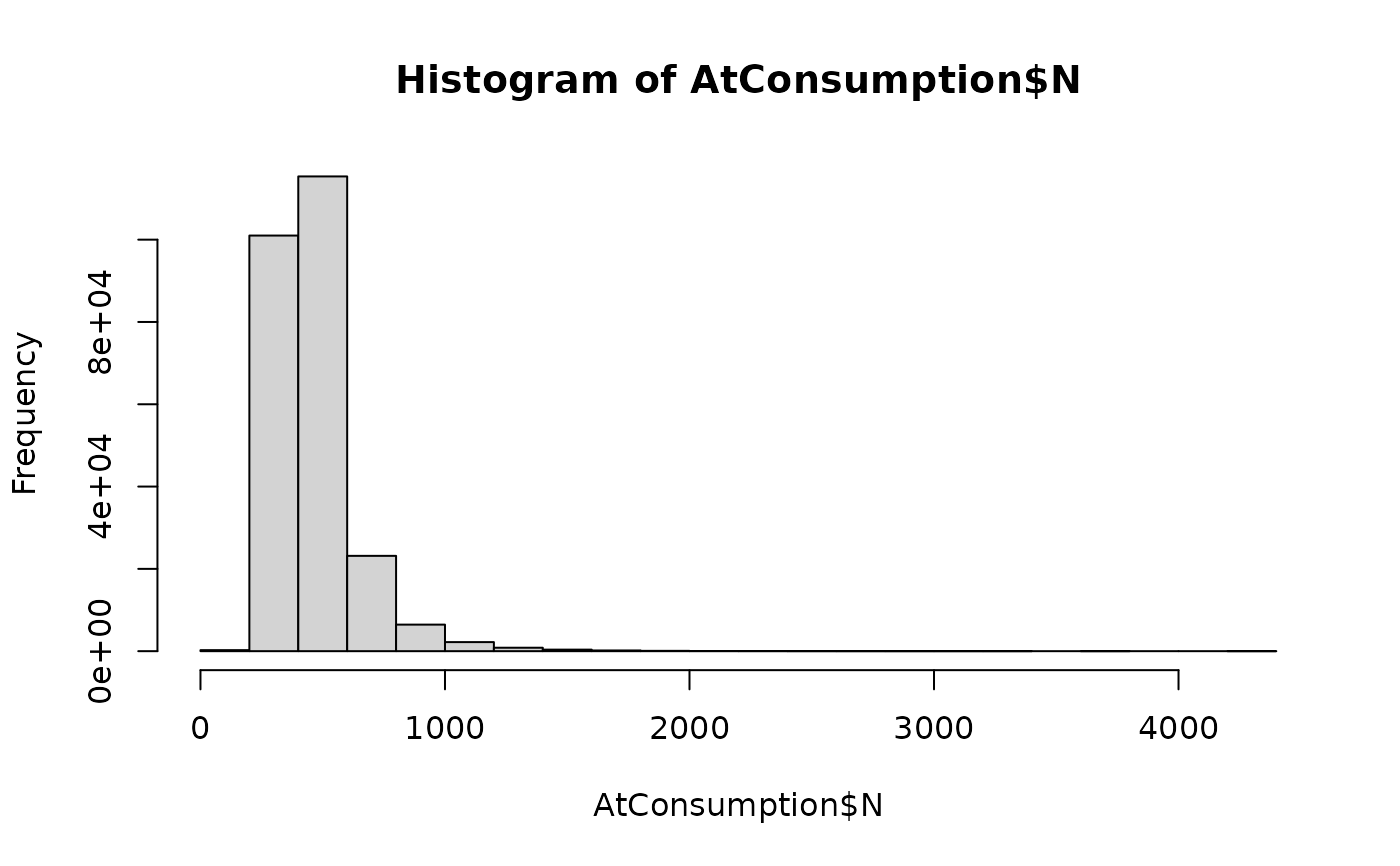
hist(AtConsumption$N)